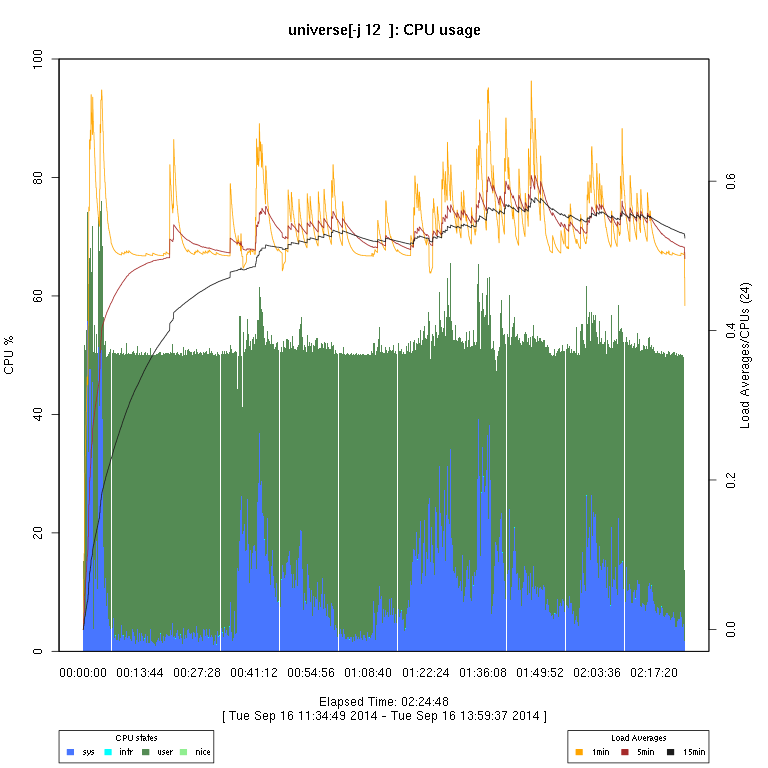

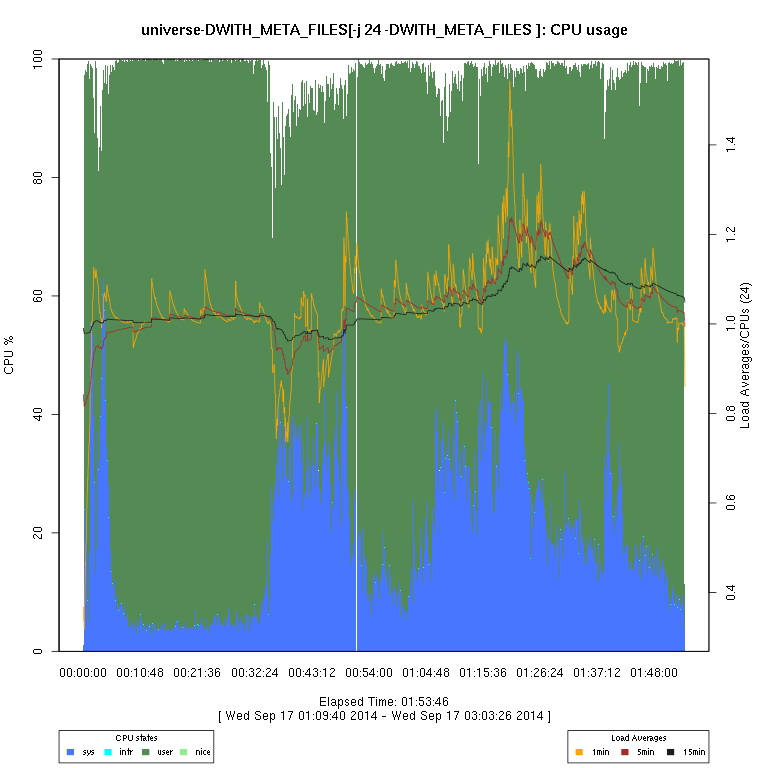


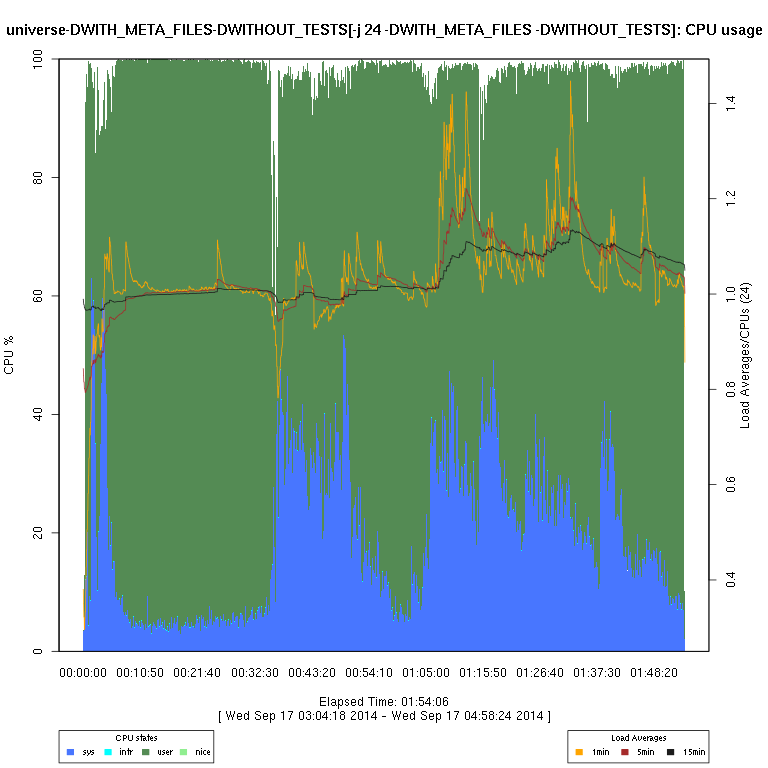

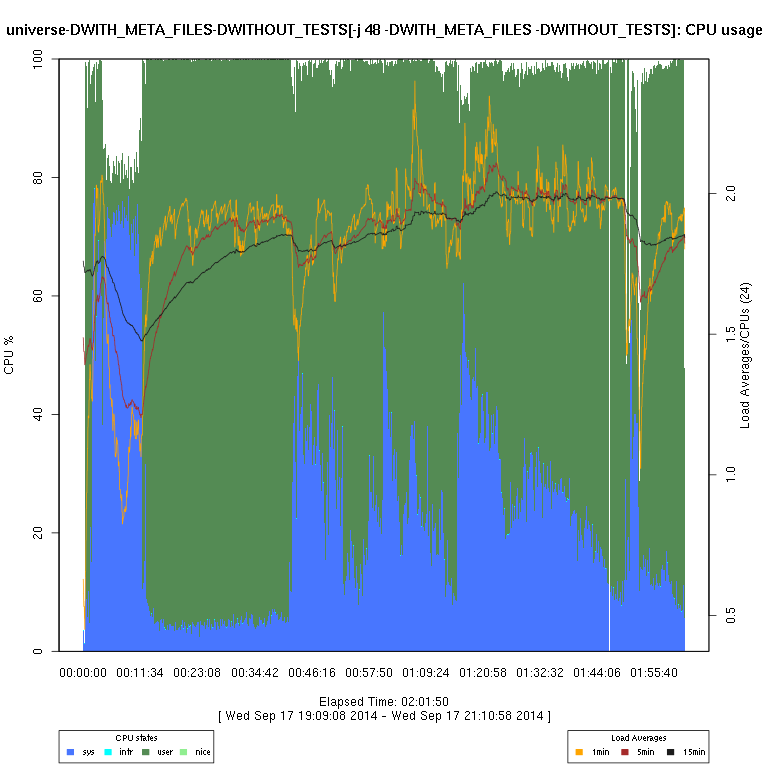
This set of graphs is from a “survey” (just one run of each configuration) of FreeBSD “make -j N ... universe” runs.
These were done on a system:
FreeBSD 10.1-BETA1 #20 r271452: Fri Sep 12 06:46:37 PDT 2014
    root@m2-test-j001.example.net:/usr/obj/usr/src/sys/M2 amd64
FreeBSD clang version 3.4.1 (tags/RELEASE_34/dot1-final 208032) 20140512
CPU: Intel(R) Xeon(R) CPU           X5690  @ 3.47GHz (3333.41-MHz K8-class CPU)
  Origin = "GenuineIntel"  Id = 0x206c2  Family = 0x6  Model = 0x2c  Stepping = 2
  Features=0xbfebfbff
  Features2=0x9ee3fd
  AMD Features=0x2c100800
  AMD Features2=0x1
  VT-x: PAT,HLT,MTF,PAUSE,EPT,UG,VPID
  TSC: P-state invariant, performance statistics
real memory  = 103079215104 (98304 MB)
avail memory = 100121542656 (95483 MB)
Event timer "LAPIC" quality 600
ACPI APIC Table: <091410 APIC1842>
FreeBSD/SMP: Multiprocessor System Detected: 24 CPUs
FreeBSD/SMP: 2 package(s) x 6 core(s) x 2 SMT threads
The src directory was of FreeBSD stable/10 @r271444.
/etc/src.conf is:
CC=clang
CXX=clang++
CPP=clang-cpp
WITH_LIBCPLUSPLUS=yes
/etc/make.conf is:
WITH_PKGNG=yes
The tests consist of a single run of each of the possible combinations of:
Immediately prior to each test run, the MAKEOBJDIRPREFIX directory (which
is on the same file system as the src directory) is
removed, then re-created (as an empty directory).
Each test is run under the auspices of a Perl script which:
sysctl invocation (and, optionally,
a netstat invocation).
.p).
/usr/bin/time -lpo.
/usr/bin/time -lpo, combines that with
the “information about the environment” from step 1,
and writes a single line to a (specified) file with all of that information
(which I tend to assign a name ending in .o).
The files that the Perl script creates are set up to have (path)names that make each set (of 2 files) unique for a particular run. They are then copied to a (usually, different) machine for analysis.
These files, then, may be found here.
On the “analysis” machine, I then post-process the “raw” *.p
files to create “cooked” *.p files (which are in a CSV format).
I then use some code I wrote in R to generate the graphs. There are sometimes vertical “gaps”
in the graphs; I have not considered this to be enough of a problem to try to determine whether it's an issue
with how the data are collected or the graph-rendering code, or an overflow in a counter.
|
|
|
|
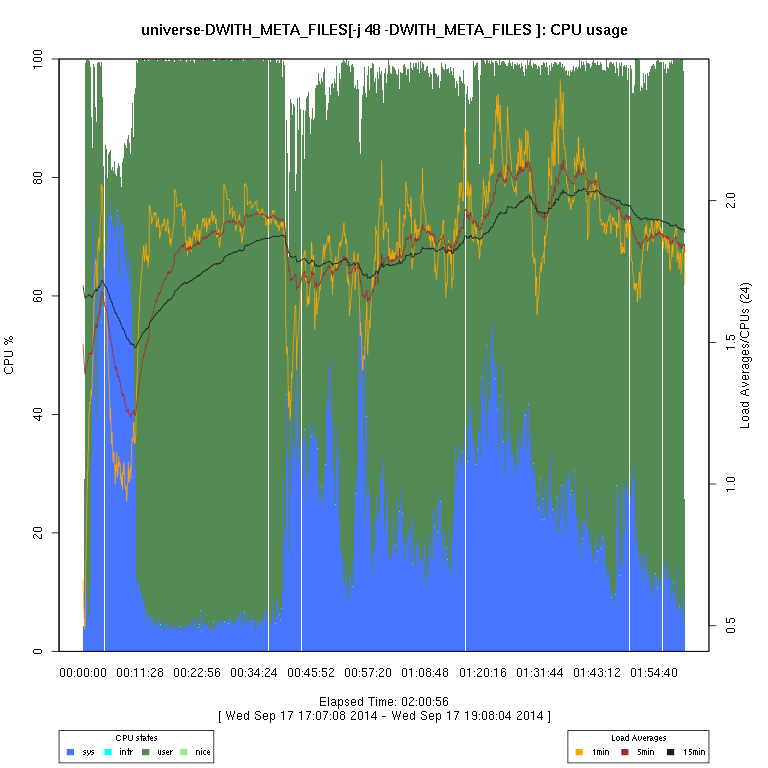
| -DWITH_META_FILES | |||
|
|
|
|
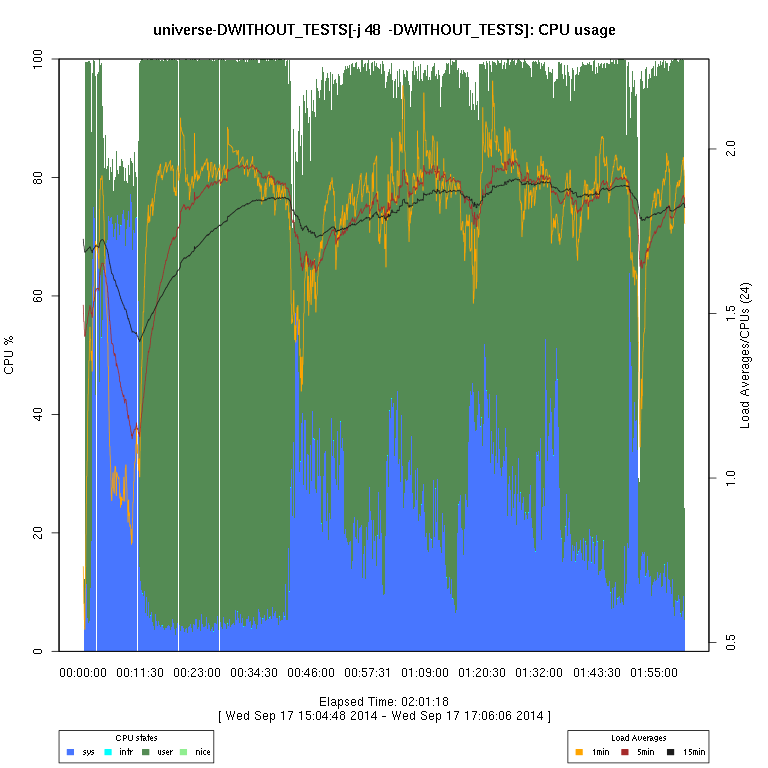
| -DWITHOUT_TESTS | |||
|
|
|
|
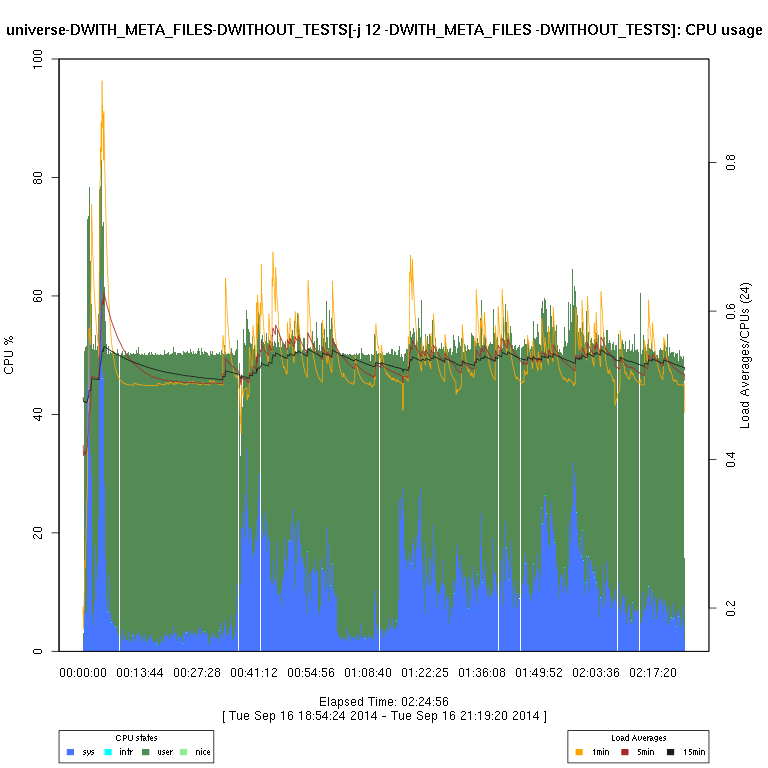
| -DWITH_META_FILES -DWITHOUT_TESTS | |||
|
|
|
|